


Revenues of S$39 Million and Adjusted EBITDA of S$5 Million
- Total revenues grew 13% to S$39 million in the third quarter 2023, as total revenues ex-Vietnam grew 23%
- Active cost management drove 69% of incremental year over year revenue into Adjusted EBITDA1
- Adjusted EBITDA grew to S$5 million in the third quarter 2023, up from S$2 million in the third quarter of 2022
Singapore – November 21, 2023 – PropertyGuru Group Limited (NYSE: PGRU) (“PropertyGuru” or the “Company”), Southeast Asia’s leading 2, property technology (“PropTech”) company, today announced financial results for the quarter ended September 30, 2023. Revenue of S$39 million in the third quarter 2023 increased 13% year over year. Net profit was S$0.3 million in the third quarter and Adjusted EBITDA3 was S$5 million. This compares to a net loss of S$7 million4 and Adjusted EBITDA of S$2 million in the third quarter of 2022.
Management Commentary

Hari V. Krishnan, Chief Executive Officer and Managing Director, said “I am pleased that we delivered another quarter of good performance despite diverse market challenges. In the face of continued macro headwinds in Vietnam and weak economic conditions across Southeast Asia, PropertyGuru produced both double-digit revenue growth and double-digit adjusted EBITDA margin for the second consecutive quarter.
As we transition from 2023 to 2024, we continue to see opportunity despite ongoing global economic uncertainty. Our unwavering commitment to helping people make informed property ownership decisions and assisting businesses in harnessing data and technology for growth and efficiency sets us up well to increase market share and develop categories ahead of the cyclic economic recovery.
We continue to invest in property technology and integrating Generative AI. Pioneering solutions that provide an agent clarity on the leads they are nurturing or a property seeker personalized feeds using GuruPicks have received good customer adoption. Our innovative solutions that shipped provided climate risk driven valuation data through DataSense, and holistic homeowner solutions to help home financing and management. Positive customer feedback sets us up well while our multi-pronged strategy should build significant moats for the core business.
We have confidence in the value that PropertyGuru creates for all our stakeholders, but we acknowledge our susceptibility to local economic fluctuations. For instance, the timing of Vietnam’s property market stabilization remains uncertain, prompting us to be laser focused on our company-wide investments as we await greater clarity in 2024.
We believe in the fundamental opportunities in our core markets and remain committed to future growth and profitability anchored around our vision to power communities to live, work, and thrive in tomorrow’s cities.”

Joe Dische, Chief Financial Officer, added “PropertyGuru delivered 13% overall revenue growth in the third quarter despite challenging market conditions in Vietnam. Excluding Vietnam, revenues were up a solid 23%. The reported revenue for Malaysia was adversely impacted by depreciation of the local currency.
Beyond our double-digit growth this quarter in the face of a challenging environment, we are especially encouraged that our cost control efforts continue to yield measurable results. Our Adjusted EBITDA margin of 13% is a strong improvement from 6% in the third quarter of 2022. This is the second quarter in a row that we achieved a double-digit Adjusted EBITDA margin, with all of our Marketplaces delivering a profit. In addition, both net income in the third quarter and year-to-date cash flow were positive.
We are focused on delivering ongoing improvements in operating leverage through technology, automation, machine learning and prudent cost management. Our objective is to deliver sustained increases in Adjusted EBITDA margin.
A recovery in Vietnam’s property market is not expected in 2023. Combined with macro-economic and exchange rate challenges in Malaysia, we are lowering our 2023 revenue outlook to S$148-S$152 million. Through effective expense management, our 2023 Adjusted EBITDA outlook remains unchanged at S$11-S$15 million.”
Financial Highlights – Third Quarter 2023
- Total revenue increased 13% year over year to S$39 million in the third quarter.
- Marketplaces revenues increased 13% year over year to S$38 million in the third quarter as continued strength in Singapore helped to offset ongoing challenges in Vietnam.
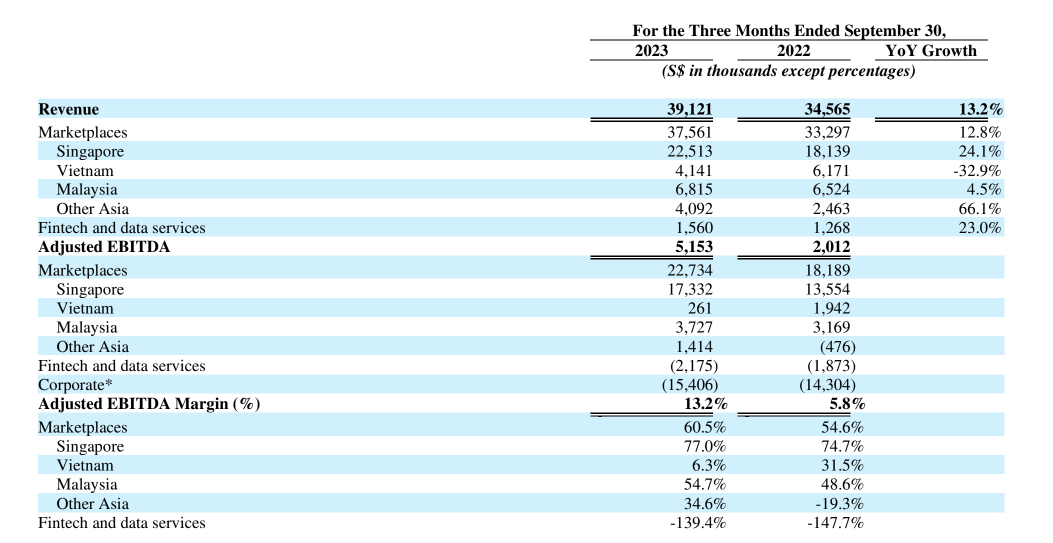
- Revenue by segment:
- Singapore Marketplaces revenue increased 24% year over year to S$23 million, as the number of agents and the Average Revenue Per Agent (“ARPA”) grew in the quarter. Quarterly ARPA was up 23% in the third quarter to S$1,279 as compared to the prior year quarter and the number of agents in Singapore was up over 200 to 16,309 from the second quarter of 2023. The renewal rate was 85% in the quarter.
- Malaysia Marketplaces revenue increased 5% year over year to S$7 million, driven by the ongoing benefit from the Company’s dual brand strategy, offset by macro headwinds. Revenue on a Singapore Dollar basis was negatively impacted by depreciation of the Malaysian Ringgit. On a local currency basis, year over year growth was 11%.
- Vietnam Marketplaces revenue decreased 33% year over year to S$4 million, as a reduction in the number of listings was partially offset by an increase in the average revenue per listing (“ARPL”). The number of listings was down 41% to 1.2 million in the third quarter compared to the prior year quarter and ARPL was up 16% to S$3.37 from the third quarter of 2022.
- Fintech & Data services revenue increased 23% to S$2 million.
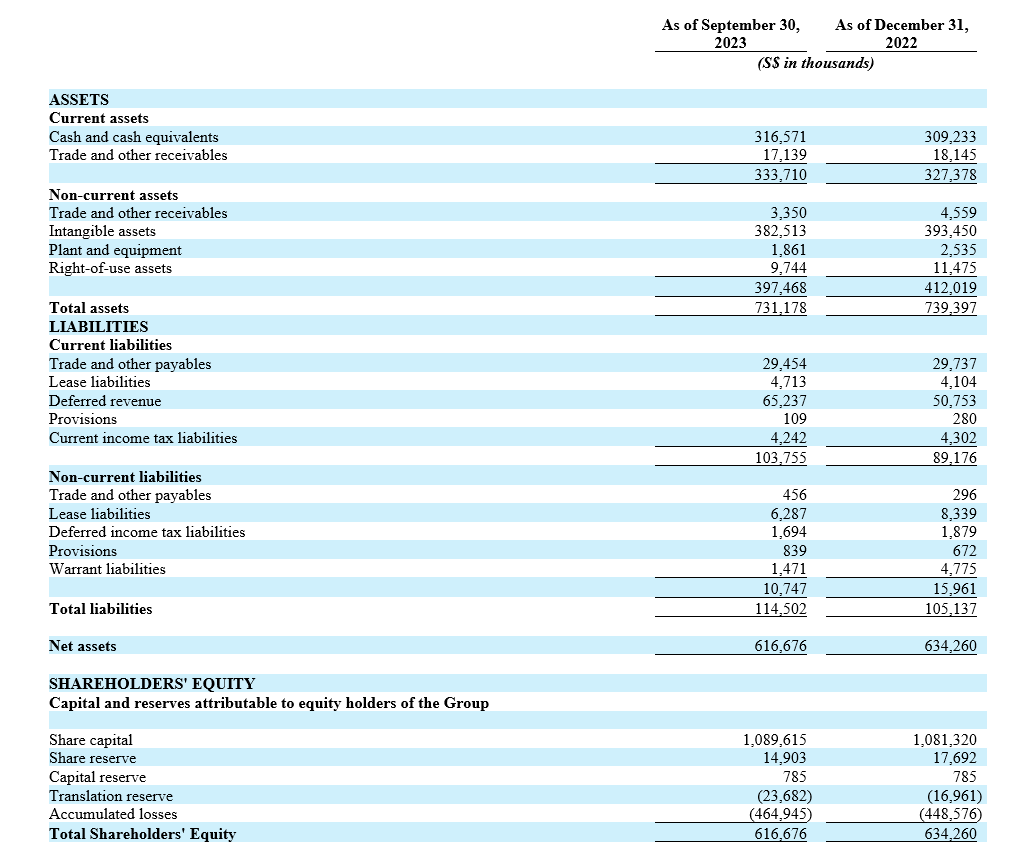
- At quarter-end, cash and cash equivalents were S$317 million.
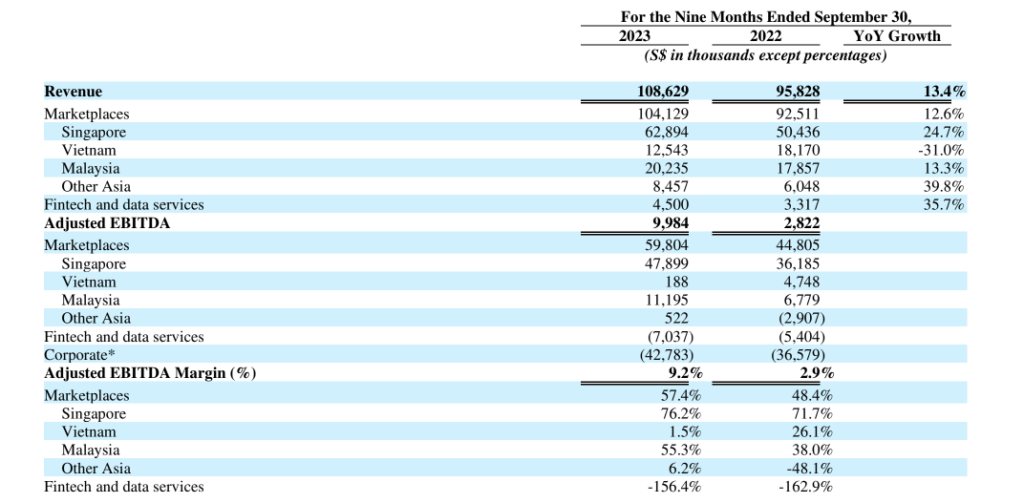
Information regarding our operating segments is presented below. It is noted that in 2023 the Company is no longer removing the ongoing cost of being a listed entity when calculating Adjusted EBITDA. As such the 2022 comparatives have been restated.
Strong Category Leadership Drives Long-Term Growth Opportunities
As of September 30, 2023, PropertyGuru continued its Engagement Market Share5 leadership in Singapore, Vietnam, Malaysia, and Thailand.
Full Year 2023 Outlook
Vietnam’s property market continues to be affected by government policy interventions that negatively impact consumer sentiment and transaction volumes. In addition, macro-economic issues and currency depreciation have affected the Malaysian business. As a result, the Company now projects full year 2023 revenue to be between S$148 million and S$152 million. Active cost control measures have helped the Company reaffirm full year 2023 Adjusted EBITDA of between S$11 million and S$15 million.
In the short term, Company results may be influenced by several factors outside of its control. These factors include the aforementioned issues in Vietnam and Malaysia as well as property taxation and stamp duty increases in Singapore and a lack of clarity in global fiscal policy stemming from rising interest rates, greater inflationary pressures, and global supply chain complications impacting our customers. Longer-term, the Company remains bullish on its growth trajectory, prospects for improving profitability, and the fundamental opportunity that exists in our core markets.
Conference Call and Webcast Details
The Company will host a conference call and webcast on Tuesday, November 21, 2023, at 7:30 a.m. Eastern Standard Time / 8:30 p.m. Singapore Standard Time to discuss the Company’s financial results for the third quarter of 2023 and full year 2023 outlook. The PropertyGuru (NYSE: PGRU) Q3 2023 Earnings call can be accessed by registering at:
https://propertyguru.zoom.us/webinar/register/WN_THHA36STR7SUFfdO3jUFxg
An archived version will be available on the Company’s Investor Relations website after the call at https://investors.propertygurugroup.com/news-and-events/events-and-presentations/default.aspx
About PropertyGuru Group
PropertyGuru is Southeast Asia’s leading2 PropTech company, and the preferred destination for over 37 million property seekers6 to connect with over 59,000 agents7 monthly to find their dream home. PropertyGuru empowers property seekers with more than 2.9 million real estate listings8, in-depth insights, and solutions that enable them to make confident property decisions across Singapore, Malaysia, Thailand, Indonesia and Vietnam.
PropertyGuru.com.sg was launched in Singapore in 2007 and since then, PropertyGuru Group has made the property journey a transparent one for property seekers in Southeast Asia. In the last 15 years, PropertyGuru has grown into a high-growth PropTech company with a robust portfolio including leading property marketplaces and award-winning mobile apps across its core markets; mortgage marketplace, PropertyGuru Finance; home services platform, Sendhelper; a host of proprietary enterprise solutions under PropertyGuru For Business including DataSense, ValueNet, , Awards, events and publications across Asia.
1 Calculated as the increase in Adjusted EBITDA in the third quarter 2023 year over year divided by the increase in revenue over the same period.
2 Based on SimilarWeb data between April 2023 and September 2023.
3 Included in the S$5 million of adjustments between net income and Adjusted EBITDA in the third quarter of 2023 was a S$6 million depreciation and amortization expense.
4 Included in the S$9 million of adjustments between net loss and Adjusted EBITDA in the third quarter of 2022 was a S$5 million depreciation and amortization expense.
5 Based on SimilarWeb data between April 2023 and September 2023.
6 Based on Google Analytics data between April 2023 and September 2023.
7 Based on data between July 2023 and September 2023.
8 Based on data between April 2023 and September 2023.
For more information, please visit: PropertyGuruGroup.com; PropertyGuru Group on LinkedIn.
Contact Information:
Key Performance Metrics and Non-IFRS Financial Measures
Our priority markets comprise Singapore, Vietnam, Malaysia and Thailand. Our core markets comprise Singapore, Vietnam, Malaysia, and Thailand.
Engagement Market Share is the average monthly engagement for websites owned by PropertyGuru as compared to average monthly engagement for a basket of peers calculated over the relevant period. Engagement is calculated as the number of visits to a website during a period multiplied by the total amount of time spent on that website for the same period, in each case based on data from SimilarWeb. Engagement Market Share is based on the prevailing SimilarWeb algorithm on the date the Company first filed or furnished such information to the U.S. Securities and Exchange Commission (“SEC”).
Number of agents in all core markets except Vietnam is calculated for a period as the sum of the number of agents with a valid 12-month subscription package at the end of each month in a period divided by the number of months in such period. In Vietnam, number of agents is calculated as the average monthly number of agents who credit money into their account within the relevant period. When counting in aggregate across the PropertyGuru group, in markets where PropertyGuru operates more than one property portal, an agent with subscriptions to more than one portal is only counted once.
Number of real estate listings is calculated as the average number of listings created monthly during the period for Vietnam and the average number of monthly listings available in the period for other markets.
Average revenue per agent (“ARPA”) is calculated as agent revenue for a period divided by the average number of agents in that period, which is calculated as the sum of the number of total agents at the end of each month in a period divided by the number of months in such period.
Number of listings in Vietnam is calculated as the sum of all listings created in each month over the relevant period (other than listings from promotional accounts). Number of listings is used to calculate average revenue per listing, which is described below.
Average revenue per listing (“ARPL”) is calculated as revenue for a period divided by the number of listings in such period.
Renewal rate is calculated as the number of agents that successfully renew their annual package during a period divided by the number of agents whose packages are up for renewal (at the end of their twelve-month subscription) during that period.
This press release also includes references to non-IFRS financial measures, namely Adjusted EBITDA, Adjusted EBITDA Margin and incremental Adjusted EBITDA over incremental revenue. PropertyGuru uses these measures, collectively, to evaluate ongoing operations and for internal planning and forecasting purposes. PropertyGuru believes that non-IFRS information, when taken collectively, may be helpful to investors because it provides consistency and comparability with past financial performance and may assist in comparisons with other companies to the extent that such other companies use similar non-IFRS measures to supplement their IFRS or GAAP results. These non-IFRS measures are presented for supplemental informational purposes only and should not be considered a substitute for financial information presented in accordance with IFRS, and may be different from similarly titled non-IFRS measures used by other companies. Accordingly, non-IFRS measures have limitations as analytical tools, and should not be considered in isolation or as substitutes for analysis of other IFRS financial measures, such as net loss and loss before income tax.
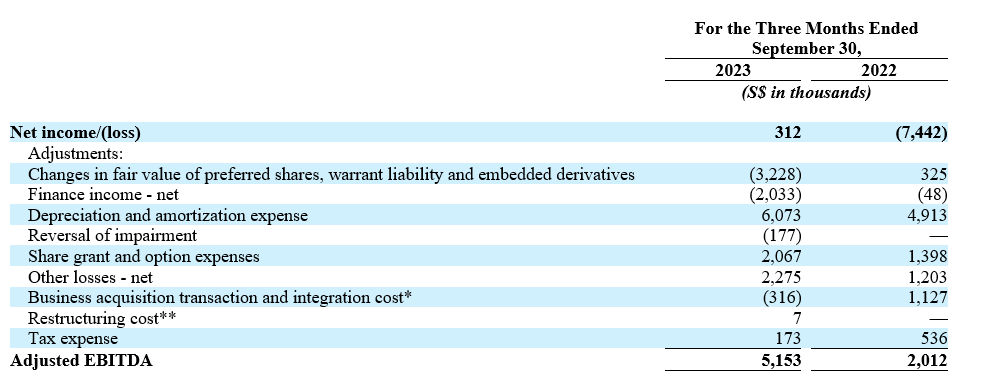
Adjusted EBITDA is a non-IFRS financial measure defined as net profit/loss for year/period adjusted for changes in fair value of preferred shares, warrant liability and embedded derivatives, finance costs, depreciation and amortization, tax expenses or credits, impairments when the impairment is the result of an isolated, non-recurring event, share grant and option expenses, loss on disposal of plant and equipment and intangible assets, currency translation profit or loss, fair value profit or loss on lease modifications and contingent consideration, business acquisition transaction and integration cost (including contingent consideration), the cost of listing or IPO activities.
Adjusted EBITDA Margin is defined as Adjusted EBITDA as a percentage of revenue.
Incremental Adjusted EBITDA over incremental revenue is calculated as the increase in Adjusted EBITDA over the period divided by the increase in revenue over the same period.
A reconciliation of net (loss)/income to Adjusted EBITDA is provided as follows. It is noted that in 2023 the Company is no longer removing the ongoing cost of being a listed entity when calculating Adjusted EBITDA. As such, the 2022 comparative has been restated.
Forward-Looking Statements
Forward-looking statements in this press release, which are not historical facts, are forward-looking statements within the meaning of the Private Securities Litigation Reform Act of 1955. These statements include statements regarding our future results of operations and financial position, planned products and services, business strategy and plans, objectives of management for future operations of PropertyGuru, market size and growth opportunities, competitive position and technological and market trends and involve known and unknown risks that are difficult to predict. As a result, our actual results, performance or achievements may differ materially from those expressed or implied by these forward-looking statements. In some cases, you can identify forward-looking statements because they contain words such as “may,” “will,” “shall,” “should,” “expects,” “plans,” “anticipates,” “could,” “intends,” “target,” “projects,” “contemplates,” “believes,” “estimates,” “predicts,” “potential,” “goal,” “objective,” “seeks,” or “continue” or the negative of these words or other similar terms or expressions that concern our expectations, strategy, plans, or intentions. Such forward-looking statements are necessarily based upon estimates and assumptions that, while considered reasonable by us and our management, are inherently uncertain. Factors that may cause actual results to differ materially from current expectations include, but are not limited to: changes in domestic and foreign business, market, financial, political and legal conditions; competitive pressures in and any disruption to the industry in which PropertyGuru and its subsidiaries (the “Group”) operates; the Group’s ability to sustain profitability despite a history of losses; the Group’s ability to implement its growth strategies and manage its growth; customers of the Group continuing to make valuable contributions to its platform; the Group’s ability to meet consumer expectations; the success of the Group’s new product or service offerings; the Group’s ability to produce accurate forecasts of its operating and financial results; the Group’s ability to attract traffic to its websites; the Group’s ability to assess property values accurately; the Group’s internal controls; the impact of rising inflation and interest rates on the Group’s business, real estate markets and the economy in general; the impact of government and regulatory policies on real estate or credit markets in Vietnam and other countries in which the Group operates; fluctuations in foreign currency exchange rates, particularly in Malaysia; the Group’s ability to raise capital; media coverage of the Group; the Group’s ability to obtain insurance coverage; changes in the regulatory environments (such as anti-trust laws, foreign ownership restrictions and tax regimes) of the countries in which the Group operates; general economic conditions in the countries in which the Group operates; political instability in the jurisdictions in which the Group operates; political unrest, terrorist activities and other geopolitical risks, including the ongoing military actions between Russia and Ukraine and between Israel and Hamas; the Group’s ability to attract and retain management and skilled employees; the impact of the COVID-19 pandemic on the business of the Group; the Group’s ability to integrate newly acquired businesses or companies and the success of the Group’s strategic investments and acquisitions; changes in the Group’s relationship with its current customers, suppliers and service providers; disruptions to information technology systems and networks; the Group’s ability to grow and protect its brand and the Group’s reputation; the Group’s ability to protect its intellectual property; changes in regulation and other contingencies; the Group’s ability to achieve tax efficiencies of its corporate structure and intercompany arrangements; potential and future litigation that the Group may be involved in; unanticipated losses, write-downs or write-offs; restructuring and impairment or other charges, taxes or other liabilities that may be incurred or required subsequent to, or in connection with, the consummation of the Group’s completed business combination; technological advancements in the Group’s industry; and other risks discussed in our filings with the SEC.
All forward-looking statements attributable to us or persons acting on our behalf are expressly qualified in their entirety by the cautionary statements set forth above. We caution you not to place undue reliance on any forward-looking statements, which are made only as of the date of this press release. We do not undertake or assume any obligation to update publicly any of these forward-looking statements to reflect actual results, new information or future events, changes in assumptions or changes in other factors affecting forward-looking statements, except to the extent required by applicable law. If we update one or more forward-looking statements, no inference should be drawn that we will make additional updates with respect to those or other forward-looking statements. The inclusion of any statement in this press release does not constitute an admission by PropertyGuru or any other person that the events or circumstances described in such statement are material. Undue reliance should not be placed upon the forward-looking statements.
Industry and Market Data
This press release contains information, estimates and other statistical data derived from third party sources and/or industry or general publications, including estimated insights from SimilarWeb and Google Analytics. Such information involves a number of assumptions and limitations, and you are cautioned not to place undue weight on such estimates. PropertyGuru has not independently verified such third-party information, and makes no representation as to the accuracy of such third-party information.
PROPERTYGURU GROUP LIMITED AND ITS SUBSIDIARIES UNAUDITED CONSOLIDATED STATEMENTS OF COMPREHENSIVE INCOME/(LOSS)
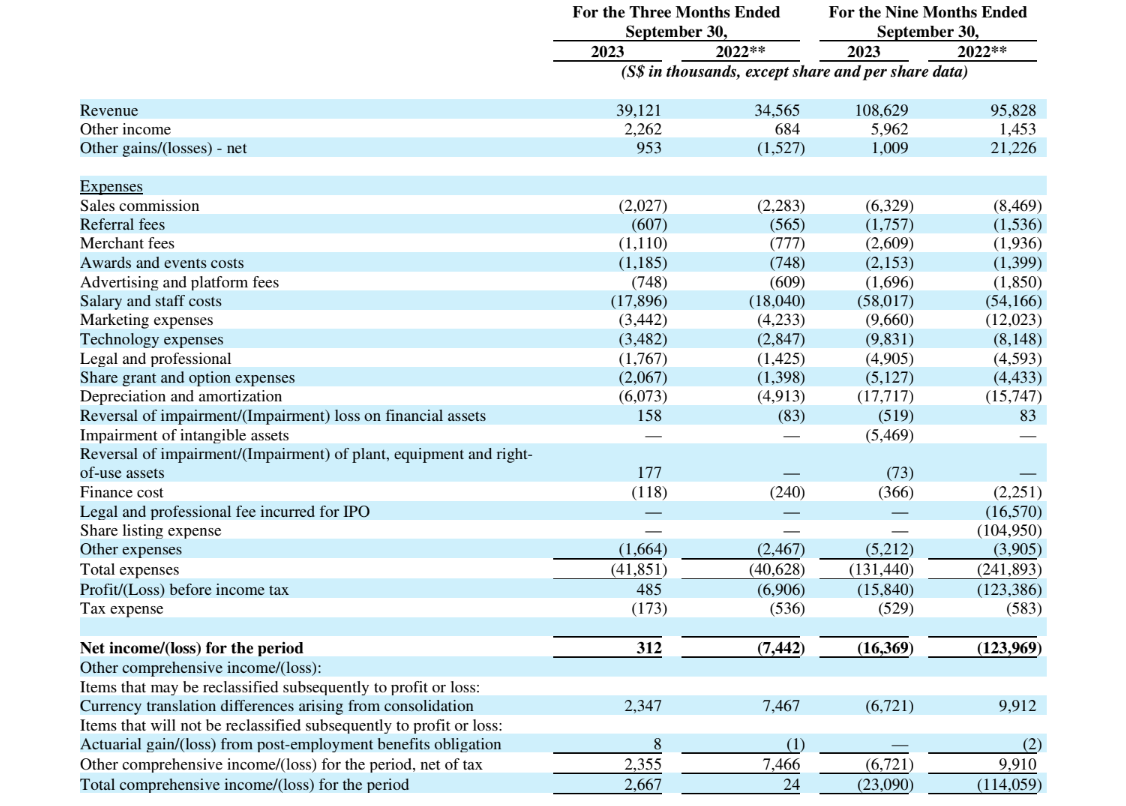

**Certain amounts in the prior year have been reclassified to conform to the current year presentation.
PROPERTYGURU GROUP LIMITED AND ITS SUBSIDIARIES UNAUDITED CONDSOLIDATED BALANCE SHEETS
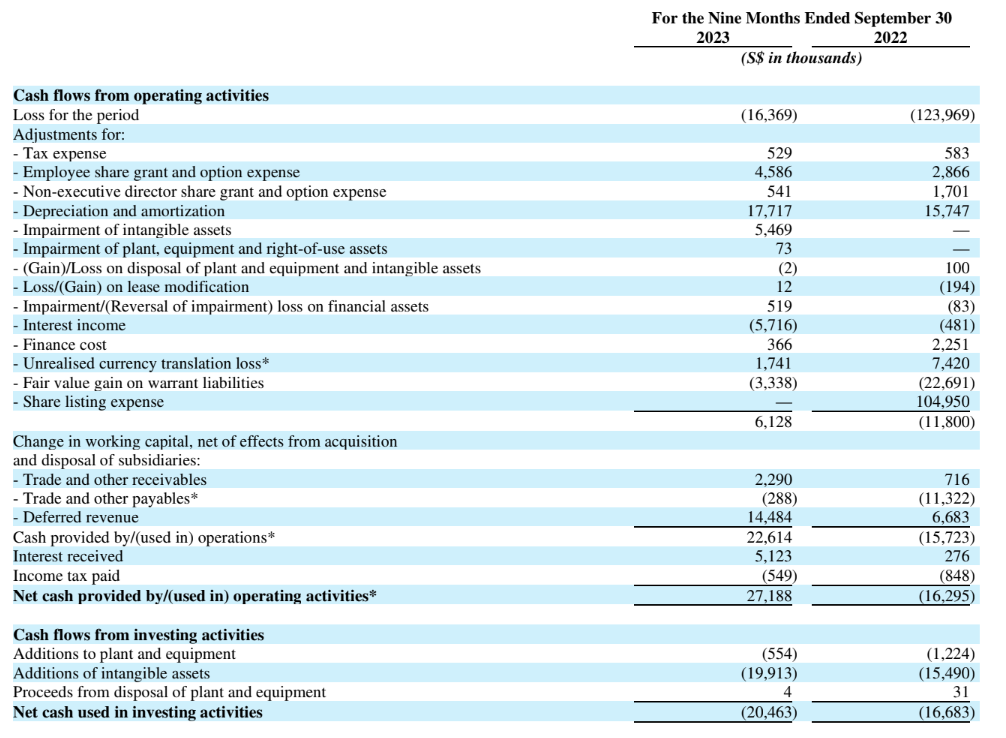
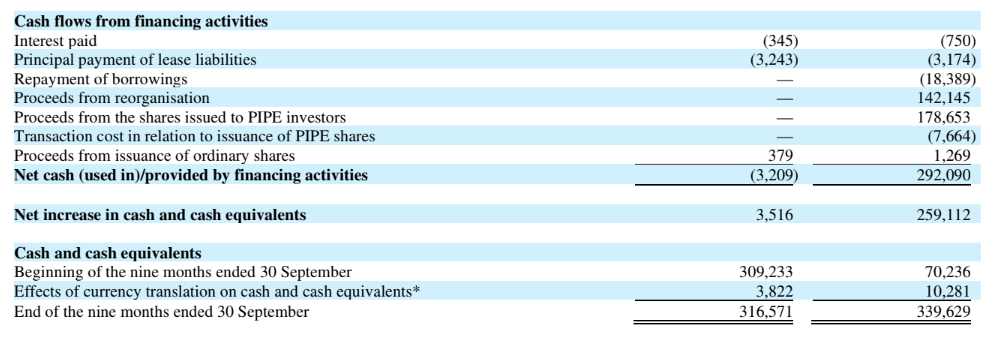
PROPERTYGURU GROUP LIMITED AND ITS SUBSIDIARIES UNAUDITED CONSOLIDATED STATEMENTS OF CASH FLOWS
*Certain amounts in the prior year have been revised to conform to the current year presentation.